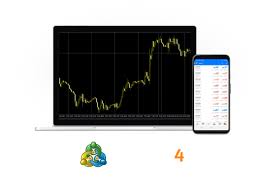
How to Leverage MetaTrader 4’s Charting Tools for Market Analysis
MetaTrader 4 (MT4) is one of the most widely used trading platforms globally, and much of its appeal can be attributed to its powerful charting tools. Whether you’re a beginner looking to improve your market analysis or an experienced trader fine-tuning your strategies, Metatrader 4 charting tools can offer significant insights and clarity.
This blog will walk you through the key features of MT4’s charting tools and how to optimize them for smarter market analysis, ensuring you stay ahead of market trends.
Why MetaTrader 4’s Charting Tools Matter
MetaTrader 4 sets itself apart with its in-depth charting capabilities, which allow traders to visualize market movements and identify trends effectively. Data visualization is critical in trading—it provides clarity in an often chaotic market. MT4’s robust tools include various chart types, timeframes, and indicators that empower traders to make quicker and more informed decisions.
Charts are particularly vital for spotting market patterns (such as head and shoulders or flag formations) and predicting future price movements. Visual analysis helps reinforce your broader trading strategy and enhances your statistical understanding of market fluctuations.
Mastering MT4’s Charting Features
1. Choose the Right Chart Type
MetaTrader 4 provides three main chart types:
• Line Chart: Useful for identifying long-term trends.
• Bar Chart: Offers a more detailed view by showing open, close, high, and low prices for each period.
• Candlestick Chart: Popular among traders for its detailed market insights and visually intuitive format.
Identifying the ideal chart type for your strategy can significantly improve analysis efficiency.
2. Utilize Multiple Timeframes
MT4 allows you to view data across various timeframes, ranging from one minute to one month. Analyzing multiple timeframes helps you spot short-term volatility while keeping an eye on long-term trends. Many traders use this feature to confirm signals or identify potential reversals.
3. Apply Technical Indicators and Tools
The platform boasts over 30 built-in indicators, including:
• Moving Averages (MA): Track price trends over time.
• Relative Strength Index (RSI): Measure market momentum.
• Fibonacci Retracement Tools: Predict potential turning points in the market.
Combining these indicators with your charts can offer a deeper layer of analysis.
4. Customize Your Charts
Make full use of MT4’s customization options, such as color schemes, gridlines, and zoom levels. A clean and personalized chart setup reduces distractions and allows you to focus on crucial data trends.
Wrapping It Up
Leverage the potential of MetaTrader 4’s charting tools to simplify your market analysis and improve trading results. By mastering features like multiple timeframes, technical indicators, and customizable layouts, you can transform raw market data into actionable insights. Start experimenting with these tools to refine your strategy and stay one step ahead in an ever-changing market.
Proudly powered by WordPress. Theme by Infigo Software.